Goals of this module
Table of contents
The goal of this module is to introduce basic concepts of statistics and how to make the correct interpretation of the results. Moreover, you will be able to construct your own functions to analyse your data.
What is statistics?
Statistics is the part of the scientific method that aims to collect, reduce, analyse and model real data. Statistics helps the analyse and presentation of data, and is also involved with the design of experiments, planning and defining how to collect the data in order to achieve results minimizing errors.
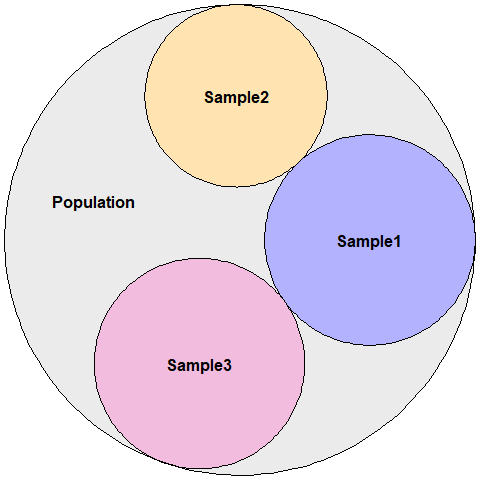
In the end, the statistical analysis should be able to tell us something concrete about the sample that we are studying and allow us to make inferences towards a population.
Statistics is normally divided into two main parts: Descriptive statistics and Inferential statistics. The descriptive analysis gives an overview about the sample and the inferential analysis tests hypothesis about the population.
Before we can understand what the data is revealing us, we have to be able to split the variables into their correct categories.
Types of variables
The variables can be classified into two main groups:
- Qualitative or Categorical
- i. Nominal (There are no order for the labels)
- i.e. Country, Gender, Brand of preference, Sides of a coin.
- ii. Ordinal (There are an order on the labels)
- i.e. Degree, State of a disease.
- i. Nominal (There are no order for the labels)
- Quantitative or Numerical
- i. Discrete (Countable)
- i.e. The number of kids, Number of births/deaths.
- ii. Continuous
- i.e. Temperature, Age.
- i. Discrete (Countable)
In this course, we will use as an example, the data from GSE$5388$, a data set containing data from controls and patients with Bipolar Disorder, some phenotypic information and the log transform of the gene expression of few genes.
- Link to the data: Pheno_DE.csv.
data = read.csv("./Pheno_DE.csv", header = T, row.names = 1)


data[1:5,1:5]
## X            Age_death   Age_onset   Alcohol_abuse   Brain_ph
## GSM123182           41          21               4       6.60
## GSM123183           51          23               3       6.67
## GSM123184           29          17               5       6.70
## GSM123185           45          16               5       6.03
## GSM123186           45          35              NA       6.35
names(data)
##  [1] "X"                         "Age_death"
##  [3] "Age_onset"                 "Alcohol_abuse"
##  [5] "Brain_ph"                  "Status"
##  [7] "Drug_abuse"                "Duration_illness"
##  [9] "Therapy_Electroconvulsive" "Therapy_Fluphenazine"
## [11] "Gender"                    "Therapy_Lithium"
## [13] "Post_morten_interval"      "Side_brain"
## [15] "Suicide"                   "Therapy_Valproate"
## [17] "APOLD1"                    "CLDN10"
## [19] "DUSP4"                     "EFEMP1"
## [21] "ETNPPL"                    "GJA1"
## [23] "PLSCR4"                    "SDC4"
## [25] "SLC14A1"                   "SOX9"
## [27] "SST"                       "TAC1"
## [29] "CX3CR1"                    "DDX3Y"
## [31] "ETNPPL.1"                  "G3BP2"
## [33] "GABRG2"                    "KDM5D"
## [35] "MAFB"                      "NBEA"
## [37] "OXR1"                      "PAK1"
## [39] "PCDH8"                     "PPID"
## [41] "PVALB"                     "RPS4Y1"
## [43] "SST.1"                     "TAC1.1"
## [45] "TBL1XR1"                   "USP9Y"
## [47] "XIST"
Exercise
- Define the type of each variable in our data set.