Network Medicine
2021-02-04
Chapter 1 Workshop in Advanced Bioinformatics: Network Medicine.
Network medicine (NetMed) is a field of Network Science that uses Systems Biology to understand its impact on medicine, and it is mostly focused on network topology. In NetMed, we often use biological networks to represent the topological space and it is used to identify disease modules, their relationship to other diseases, drug repurpusing, and drug combinations. The biological networks often used for it are based on protein-protein interactions (PPI), Gene-Disease-Associations (GDA), and Drug-Targets.
In this workshop, we will learn:
- how to identify disease modules (Session 3.1);
- how to predict disease comorbidities (Session 3.3);
- how to repurpuse drugs using a network approach (Session 4.1).
1.1 What are networks?
Adapted from Deisy Morselli Gysi and Nowick (2020).
Network Science is broadly employed in many fields: from understanding how friends bond in a party to how animals interact; from how superheroes appear in the same comic books to how genes can be related to a specific biological process. Network analysis is especially beneficial for understanding complex systems, in all research fields. Examples of complex biological or medical systems include gene regulatory, ecological, and neuropsychology networks. In this workshop, the focus is given to applications of Network Science to the Medical Sciences.
Here, I will start by introducing the basic network terminologies and then explore how can we define and identify disease modules, identify disease commorbidities, and lastly, we will learn how to repurpuse drugs for diseases with known modules. For each step, I will then present some classical and some new studies.
It is expected some degree of familiarity with R, ggplot2, tidyr, and igraph.
1.2 Terminology
While the nature of each system, i.e. what its entities are and what kind of interactions they have, is different, there are common notations. A short review of common network terms can be found in Session 1.2.1, and a brief review of biological terms can be found in Session 1.2.2.
The set of interactions among a set of entities is, in general, called a graph or a network (Newman 2018; Albert-Láslzo Barabási 2016). In graph theory, each entity is called a vertex, while in network notation it is called a node (Albert-Láslzo Barabási 2016). Accordingly, the connections between two entities are called edges or links, respectively (Albert-Láslzo Barabási 2016). In this workshop, I will always use the network notation, unless otherwise specified. The total number of nodes in a network is often denoted as N, and the number of links in a network is denoted as L. While nodes can receive a label, links in general, are not labeled (Albert-Láslzo Barabási 2016) (although, in many cases, weights can also be perceived as a label). A network can be represented mathematically as an adjacency matrix (usually denoted as A) (Table 1.1), an edge-list (Table 1.2), or visually as a graph (Figure 1.1).
| A | C | B | D | H | F | J | I | E | G | |
|---|---|---|---|---|---|---|---|---|---|---|
| A | 0 | 1 | 1 | 1 | 0 | 0 | 0 | 1 | 1 | 0 |
| C | 1 | 0 | 0 | 0 | 1 | 0 | 1 | 0 | 0 | 0 |
| B | 1 | 0 | 0 | 1 | 0 | 1 | 0 | 0 | 0 | 1 |
| D | 1 | 0 | 1 | 0 | 0 | 0 | 0 | 0 | 0 | 0 |
| H | 0 | 1 | 0 | 0 | 0 | 0 | 0 | 0 | 0 | 0 |
| F | 0 | 0 | 1 | 0 | 0 | 0 | 0 | 0 | 0 | 0 |
| J | 0 | 1 | 0 | 0 | 0 | 0 | 0 | 0 | 0 | 0 |
| I | 1 | 0 | 0 | 0 | 0 | 0 | 0 | 0 | 0 | 0 |
| E | 1 | 0 | 0 | 0 | 0 | 0 | 0 | 0 | 0 | 0 |
| G | 0 | 0 | 1 | 0 | 0 | 0 | 0 | 0 | 0 | 0 |
Links of a network can possess a direction (normally depicted by an arrow), which indicates that the interaction is asymmetric, e.g., one gene is regulating another gene, or a person follows somebody else in a social network. Networks with directed links are called directed networks, while networks without directed interactions or in which the direction is not known are referred to as undirected networks, e.g., collaboration in the same study or interactions between proteins. In NetMed - and in this workshop - we assume, most of the time, that networks do not possess a direction. The links can also have a weight to express the strength of the interaction, which results in a weighted network (Newman 2018; Albert-Láslzo Barabási 2016). Usually, the weight is graphically displayed as the thickness or the length of the links.
| Source | Target |
|---|---|
| A | D |
| C | H |
| B | F |
| C | J |
| A | I |
| B | D |
| A | B |
| A | E |
| B | G |
| A | C |
Networks can also have different dimensions. These dimensions can be understood as layers (or different link types) of the same system (Kurant and Thiran 2006; Kivela et al. 2014). For example, in a multi-omics multilayer system, each layer can be constructed using different -omics data (for example, genomics, transcriptomics, proteomics, etc.) where the ‘whole’ biological system can be understood as a network of networks (De Domenico 2017). The topology and the dynamic properties of the whole network can be changed by simply transforming the weights of the interactions, or by ignoring that nodes can interact in many ways (Mucha et al. 2010; Radicchi and Arenas 2013), also ignoring the node’s importance to the system. We will not deal with multilayer networks in this workshop.
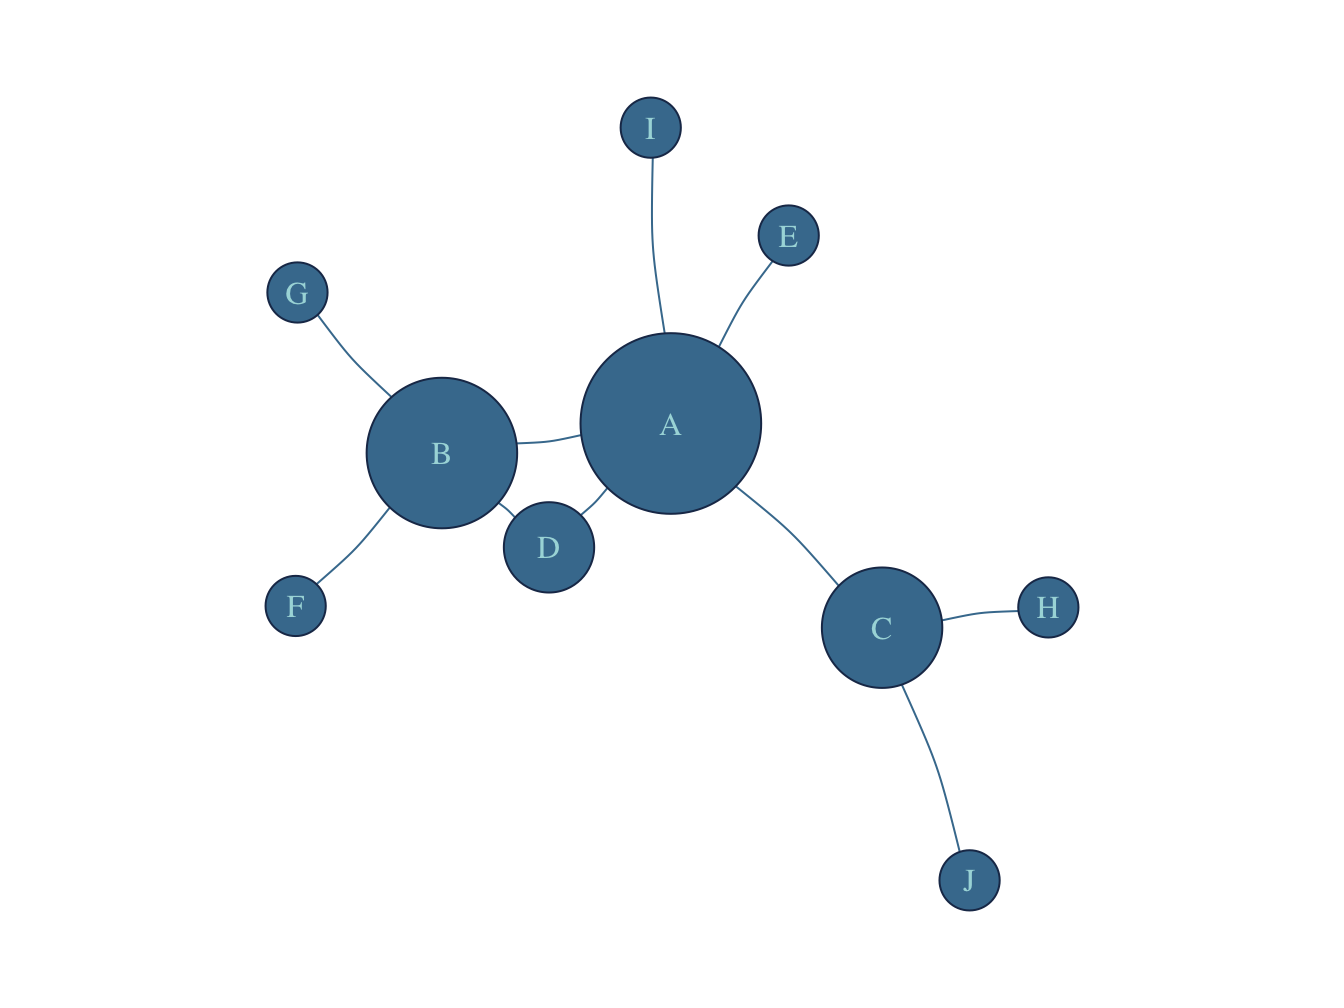
Figure 1.1: Visual Representation of a Network: Graph.
1.2.1 Network Terminology
A network is a pair G = (N, L) of a set N of nodes connected by a set L of links.
Two nodes are neighbors if they are connected. The degree (d) of a node is the number of nodes it interacts with (Bondy and Murty 2008).
The weight is a measure of how strong a particular interaction is (Bondy and Murty 2008).
The strength of a node is the sum of the weights attached to links belonging to a node (Barrat et al. 2003).
The direction of a link specifies the source (starting point) and a target (endpoint) where the interaction occurs (Albert-Láslzo Barabási 2016).
Hubs are nodes with a much larger degree compared to the average degree value (Barrat et al. 2003).
A set of highly interconnected nodes is a module or cluster (A. Li and Horvath 2009). Two nodes are connected in a network, if a sequence of adjacent nodes, a path, connects them (Albert László Barabási and Oltvai 2004).
The shortest path length is the number of links along the shortest path connecting two nodes (Albert László Barabási and Oltvai 2004).
The average path length is the average of the shortest paths between all pairs of nodes (Albert László Barabási and Oltvai 2004).
The diameter is the maximum distance between two nodes (Bondy and Murty 2008).
The modularity index is a measure of the strength of the network division into modules when this measure is maximized; it can be used for identifying nodes’ communities (Newman 2018).
Preferential attachment is the tendency of nodes to form new links preferentially to nodes with a high number of links (Albert László Barabási and Albert 1999; Vázquez 2003).
The probability that a random node in the network has a particular degree is given by the degree distribution (Albert László Barabási and Oltvai 2004).
A bipartide graph is a network in which the nodes can be divided into two disjoint sets of nodes such that links connect nodes from the two sets to each other, but never inside the same set (Albert-Láslzo Barabási 2016). In those networks, most of the network measures are calculated differently than in a unipartide network.
The clustering coefficient describes the degree with which a node is connected to all its neighbors (Albert László Barabási and Oltvai 2004).
The global clustering coefficient measures the total number of triangles in a network (Albert-Láslzo Barabási 2016).
The average clustering coefficient is the average of the clustering coefficient of all nodes in a network (Albert László Barabási and Oltvai 2004).
Centrality is a set of measures that have been proposed to help to define the most central nodes. It has many interpretations for autonomy, control, risk, exposure, influence, and power (Borgatti and Everett 2006).
Closeness centrality is defined as the average distance from a single vertex to all other vertices(Newman 2018).
Betweenness centrality is defined as the total number of shortest paths between pairs of nodes that pass through a particular node (Newman 2018).
Global measures are measures that describe the whole network, for example, degree distribution; average clustering coefficient; path length; modularity index.
Local measures are characteristics of individual nodes of a network, such as their degree and centrality.
1.2.2 Biological Terminology
DNA is the hereditary material of most organisms – usually, all cells of an organism have the same DNA (Slack 2013).
Genes are the basic physical and functional units of heredity. They are parts of the DNA and contain the information for producing functional RNAs and proteins. (Slack 2013).
Proteins are large, complex molecules that play many critical roles in the body. The proteins are responsible for most of the work in cells and are necessary for structure, function, and regulation of the cells. They can act as enzymes, antibodies, transporters, transcription factors etc. (Slack 2013).
The RNA is synthesized from the DNA but has different properties and functions than the DNA. Some RNAs carry out biological functions in a cell, while others, messenger RNA (mRNA), are turned into proteins that fulfill biological functions (Slack 2013).
A non-coding RNA (ncRNA) is an RNA that does not encode a protein. NcRNAs often play a role in gene regulation (Mattick and Makunin 2006).
microRNAs (miRNA) are examples of ncRNA; they are involved in posttranscriptional regulation of protein expression (Tanase, Ogrezeanu, and Badiu 2012).
Gene expression is, in short, the coupled process of transcription (from DNA to RNA) and translation (from RNA to proteins) to transform the stored information inside the DNA into proteins (Slack 2013).
RNA-Seq is a technique used to sequence the RNAs in a sample. The result is the snapshot abundance of all RNAs expressed in the sample at a particular time, often called the transcriptome (Metzker 2010).
Microarrays, or gene chips, are chips with thousands of tiny spots containing a known DNA sequence. It is used to measure the abundance of mRNAs by eminence of fluorescence (Slack 2013).
Transcription Factors are DNA binding proteins that activate or repress the transcription of particular target genes (Latchman 1997).
Gene Regulatory Factors are responsible for controlling the expression of genomic information and include transcription factors, co-factors, epigenetic modifiers, miRNAs, and others (Hobert 2008).
Systems Biology examines the structures and dynamics of cellular and organismal function, instead of isolated characteristics of a cell or organism.
Drug repositioning (or drug repurposing) is the process of redeveloping a compound for use in a different disease.
Yeast-Two-Hybrid (Y2H) systems is a system to measure protein-protein interaction. Two proteins to be tested for interaction are expressed in yeast; one protein is fused to a DNA-binding domain from a transcription factor while another protein (Y) is fused to a transcription activation domain. If X and Y interact, there will be a formation of a colony on media used as evidence of the interaction of X and Y (Parrish, Gulyas, and Finley 2006).
Protein complex immunoprecipitation is an alternative method for measuring protein interactions. It involves immunoprecipitation of the protein bait, purification of the complex, and the identification of the interacting partners.
High-throughput Mass Spectrometry has the ability to detect a characteristic mass to charge ratio of different substances in a sample. It is used to identify the proteins present in a sample (Kempa et al. 2019).
Chromatin immunoprecipitation followed by sequencing (ChIP–Seq) can be used to identify binding sites of transcription factors in the DNA or of histone modification in a genome-wide manner (Park 2009).
Chromatin Isolation by RNA Purification followed by sequencing (ChIRP-seq) maps lncRNA interactions to the chromatin (Park 2009).
Genome-wide association studies (GWAS) are studies where millions of SNPs are tested for association with a particular phenotype using hundreds or thousands of individuals. Those studies shed light on the genetic basis of complex traits.
Omics is a term that refers to the study of different areas in biology, and indicates the totality of some kind, e.g., genome, transcriptome, proteome, etc.